Epileptogenicity index computation
This video is intended to show how to run an ictal onset analysis using the Epileptogenicity Index (EI) tool in Halyzia.
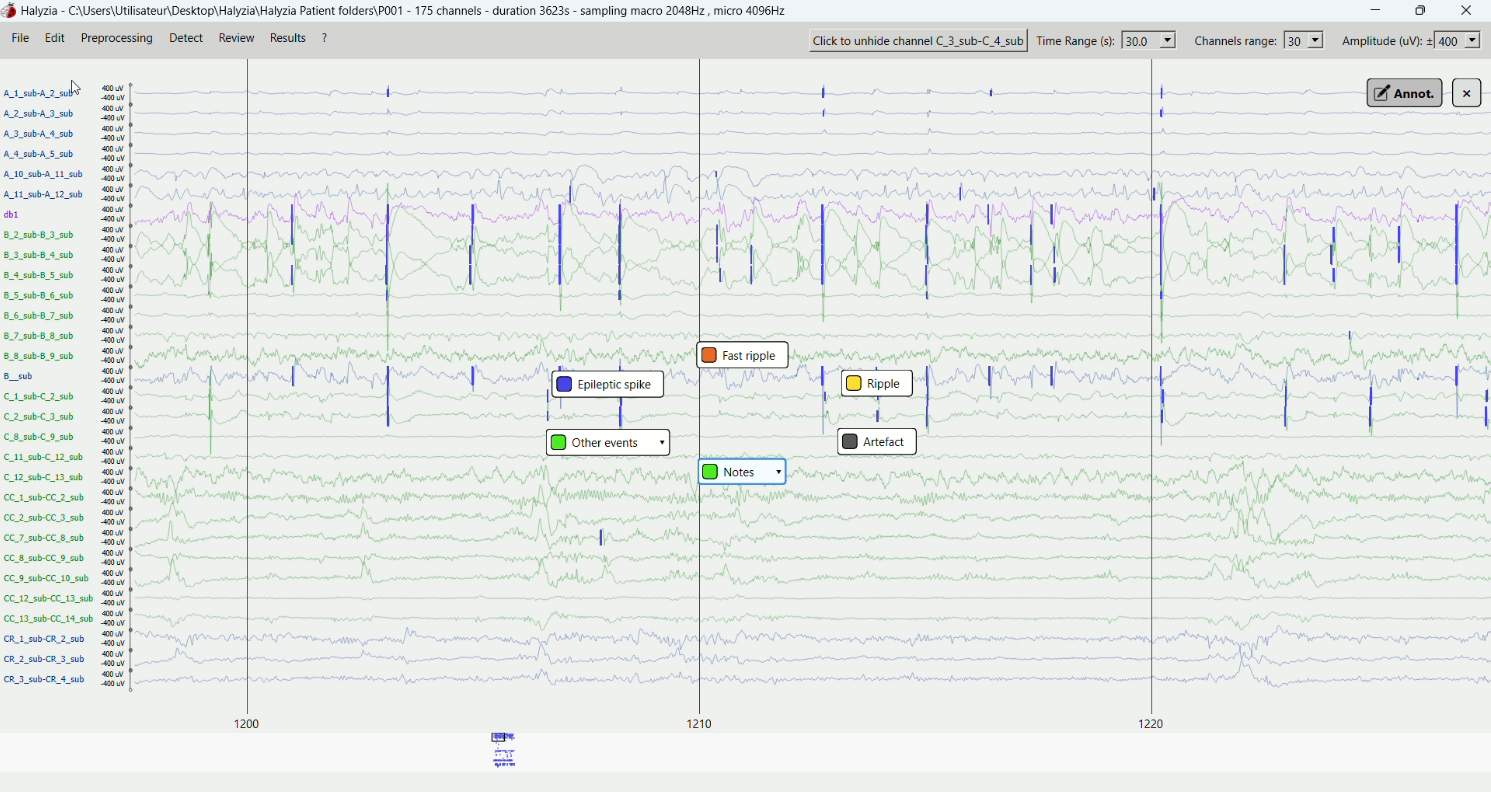
First, you need to visually identify the seizure onset in the signal. Once identified, switch to annotation mode, in the annotation wheel, select “Seizure onset”, and then double-click on the seizure onset to add a marker.
You can now launch the Epileptogenicity Index analysis by selecting this marker, right-clicking on it and clicking on “add epileptogenicity index”. At this stage, you can adjust the red highlighted time window using the arrows to define the time period to analyze. The default window is set to 50s.
Before launching the epileptogenicity index analysis, select the channels you want to compute it on. Then, to open the epileptogenicity index analysis window, double left-click on the red time window you created.
If you don’t select channels beforehand in the main viewer, the analysis will be performed on the first 10 channels of the dataset by default, but you can also change the selection of channels directly in the “Analysis Scope” panel of the EI window.
In this panel, you can also change the start and stop time of your analysis.
In the main visualization panel on the left side of the EI window:
The EEG signals are displayed in white
The colored background represents the Energy Ratio which indicates the relative strength of high- versus low-frequency activity in the signal.
The blue curve represents a cumulative sum called “UN”. It shows when a significant change in frequency content occurs over time for each channel.
The triangles mark the last local minimum before a significant change is detected. The first triangle in each channel (highlighted in orange) is the most important, as it defines the onset time used for the EI computation. If needed, you can manually adjust these triangles to refine the automatic detection.
In this main visualization panel you can:
zoom in/out on the signal using Ctrl + mouse wheel
zoom using the mouse wheel on: the EEG amplitude; the time axis; the channel list: the blue curve amplitude.
All parameters can be modified directly in the Parameters panel. You may adjust the parameters (especially bias and threshold) if needed, so that the triangles align with the frequency changes you visually identify in the ictal onset pattern. For more information on the parameters, please refer to the user manual.
Note: After any modification in the “Analysis Scope” and “Parameters” panels, you must click “Compute analysis” to update the results.
The advanced parameters correspond to the low and high frequency bands used for the Energy Ratio calculation.
The “Reset parameters” button restores default values for all settings.
By combining the Energy Ratio (ER) and the time of involvement, the EI provides a quantitative value per channel. Channels with high Energy Ratio and early onset (first triangle) will have higher EI values, meaning they are more likely to be part of the epileptogenic zone.
On the right side of the interface, a table lists EI values per channel (sorted from highest to lowest) and a bar chart displays the distribution of EI values. To open a zoom-in view of the bar chart, click on the icon in the upper-right corner.
Finally, the “Export summary” option allows you to export the EI table and the EI bar chart into an Excel file, saved in the directory of your choice.
You can also open the EI analysis window from the “Review” menu by clicking on “Event viewer” and selecting “Seizure analysis”.