
Scientific articles and communications
Discover the research behind Halyzia® and its clinical validation


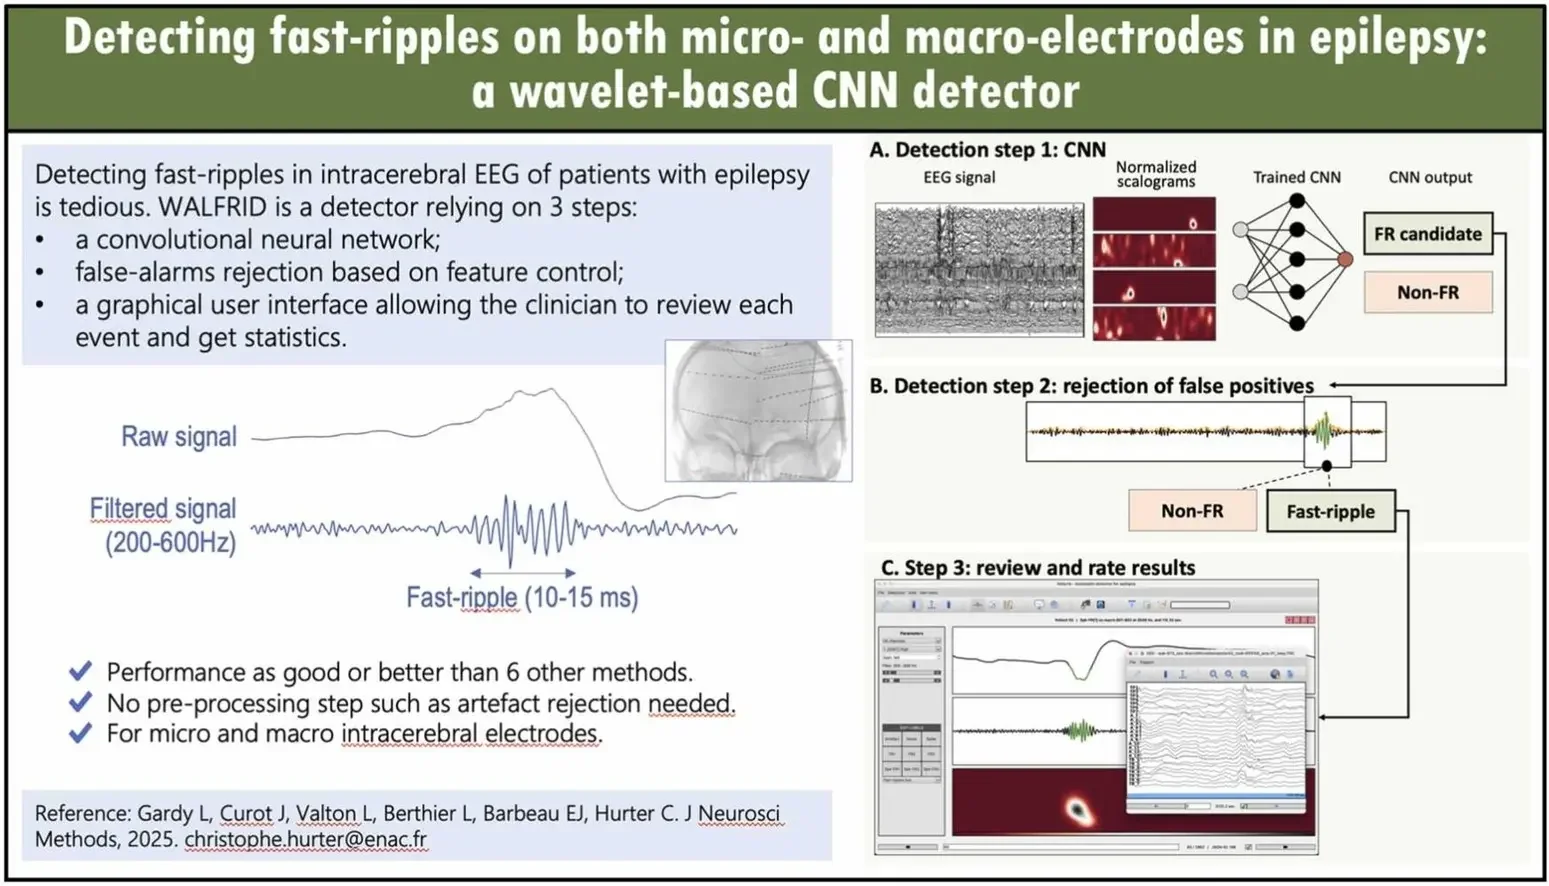
Detecting fast-ripples on both micro- and macro-electrodes in epilepsy: a wavelet-based CNN detector
Gardy L, Curot J, Valton L, Berthier L, Barbeau EJ, & Hurter C.
Journal of Neuroscience Methods, 2025 Mar:415:110350.
DOI: 10.1016/j.jneumeth.2024.110350.
Signal analysis: epileptic biomarkers
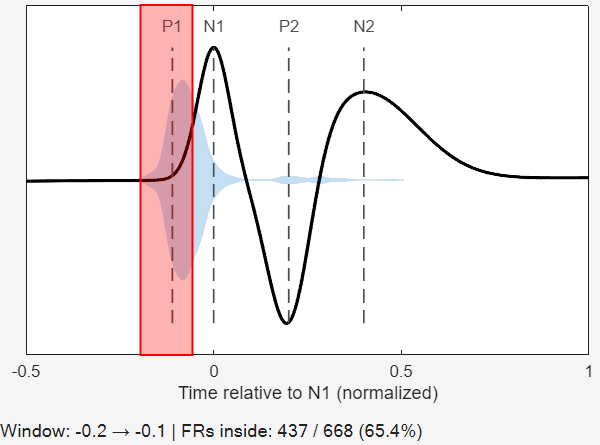
Combined interictal biomarkers
Oct. 16 2025
Detecting combined interictal biomarkers in human iEEG recordings - A new tool for clinicians within Halyzia ®
Introduction
to HFOs
May 26 2025
HFOs are brief, high-frequency oscillations observed in EEG recordings. They are typically classified into two main categories: ripples (80–200 Hz) and fast ripples (200–600 Hz)...
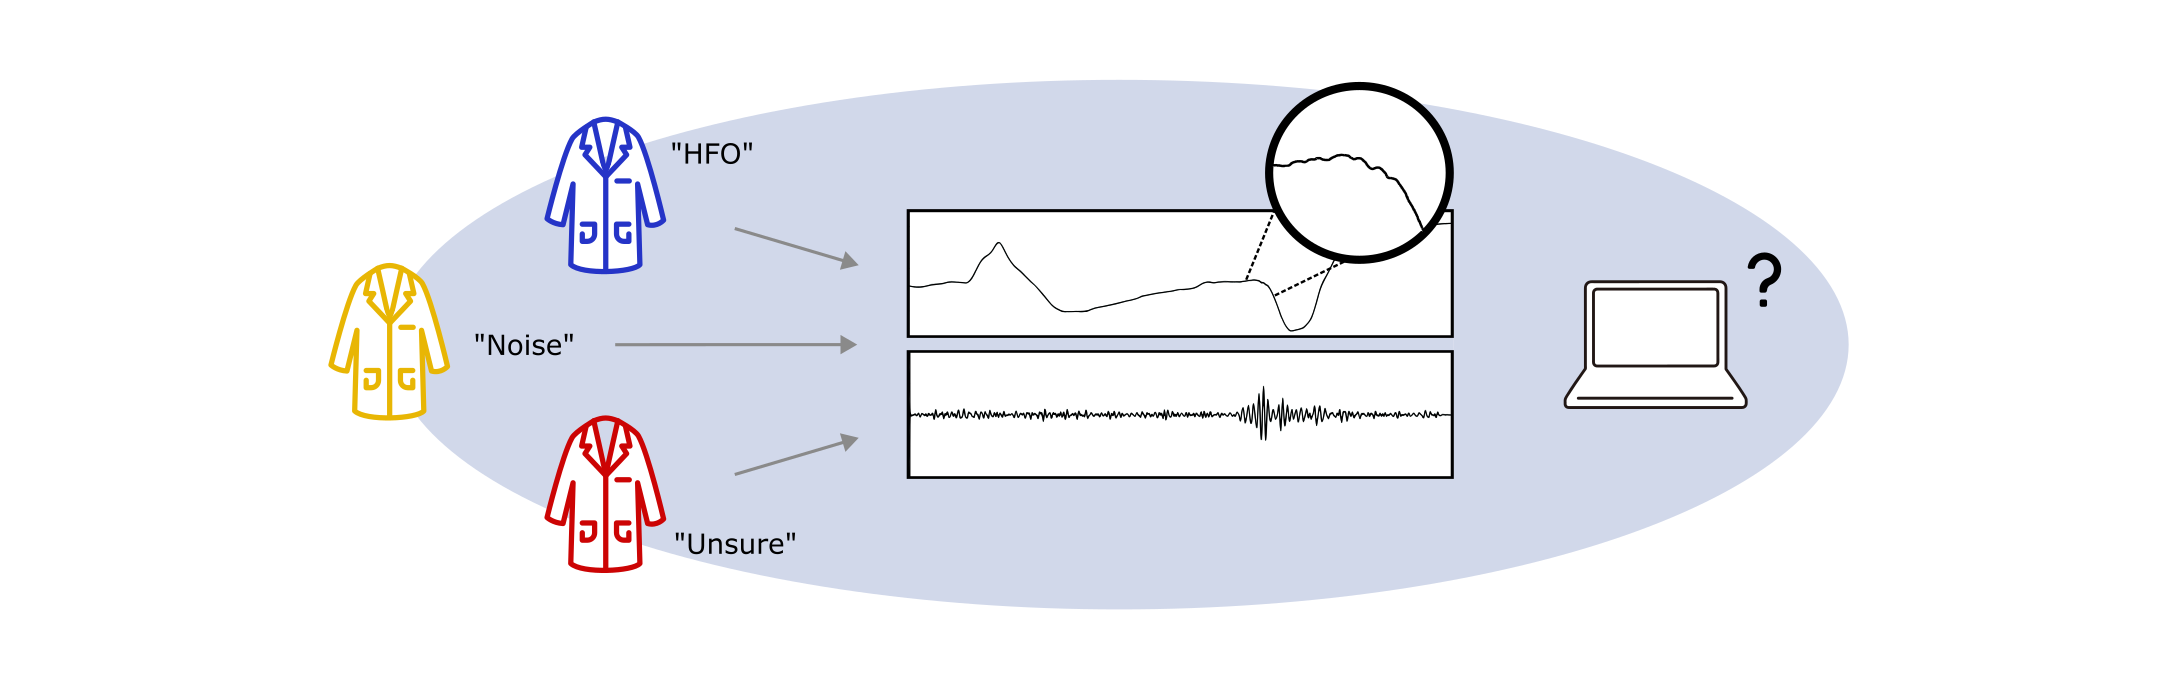
Why validating iEEG biomarker detectors is so difficult
January 7 2026
Interictal biomarkers of epilepsy such as spikes and high-frequency oscillations (HFOs) are increasingly being studied as clinical tools to guide epilepsy surgery…
Other resources
Why the name Halyzia®?
Sept. 15 2025
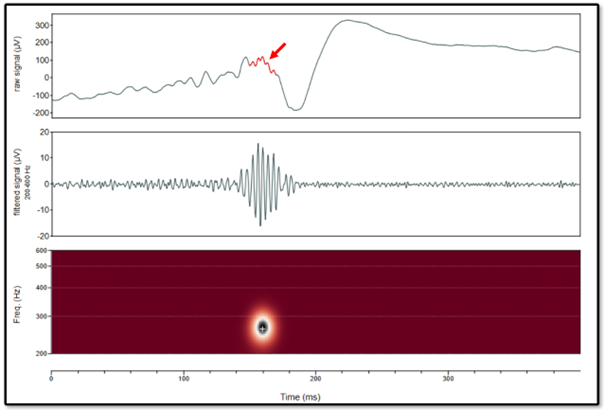
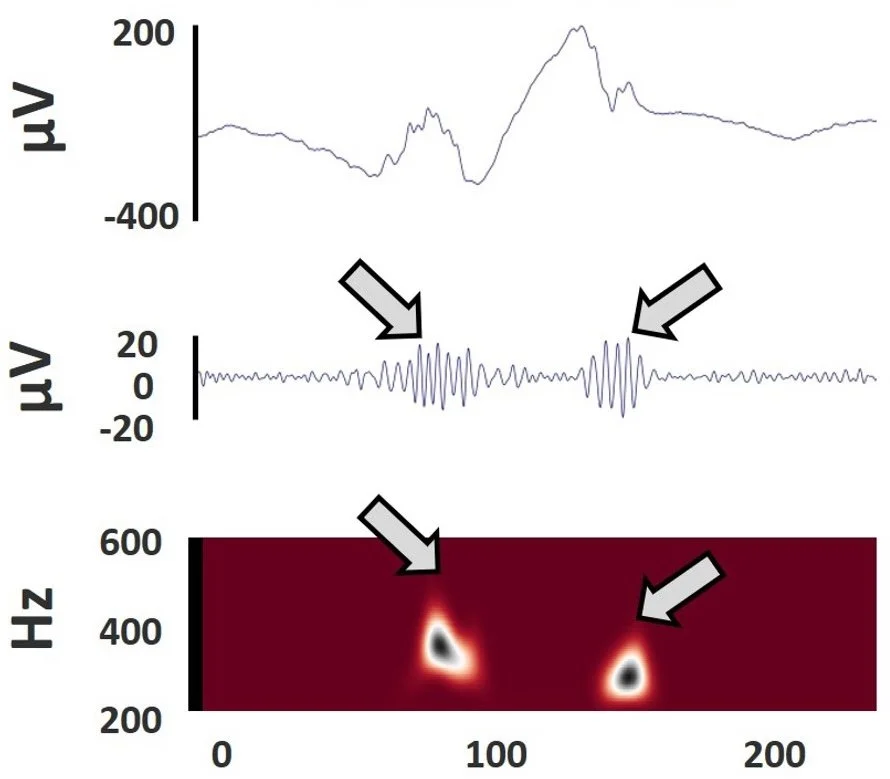
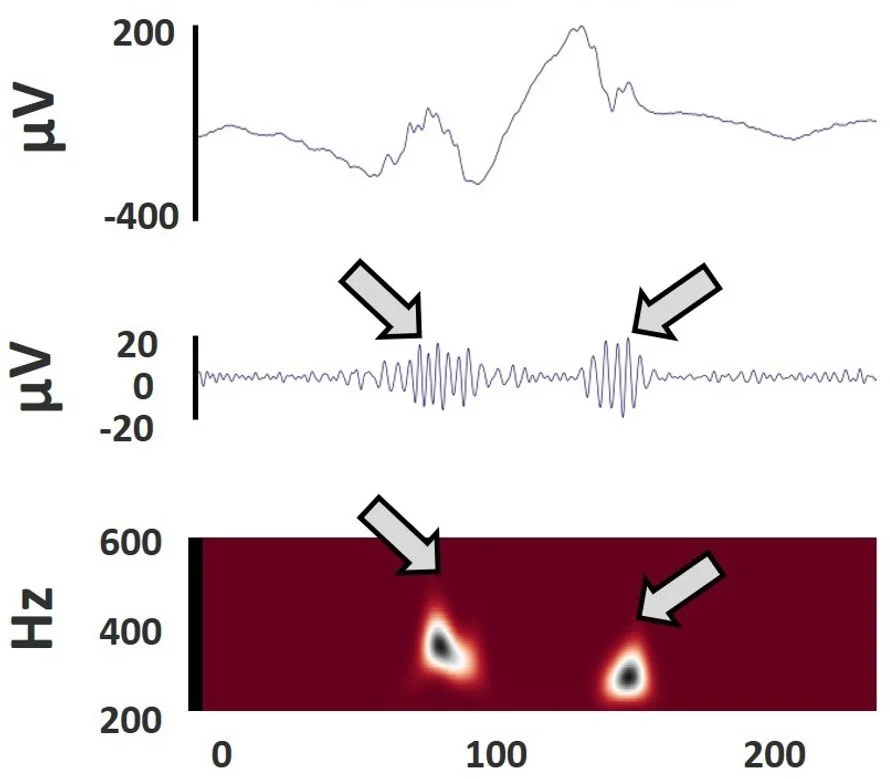
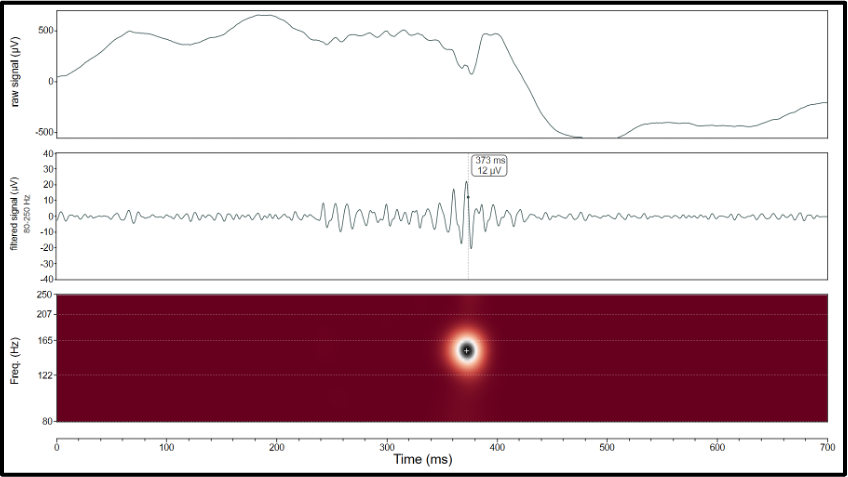
Legend has it that the mysterious blobs marking the fast-ripples on the normalized scalograms (Figure 1) bore an uncanny resemblance to the delicate colors of a ladybird
Funny scalograms
Sept. 15 2025
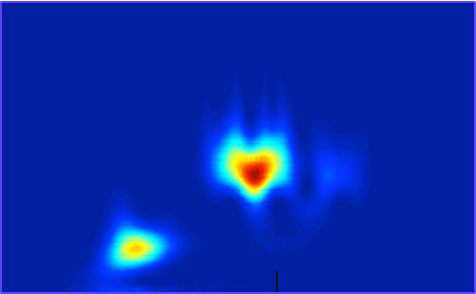
Sometimes, scalograms show weird and funny shapes.
Are you ready to unlock the full potential of intracranial EEG data ?
Subscribe to our Newsletter
Stay up to date with the latest industry news and updates from our company, subscribe to our newsletter !
By subscribing, you agree to our Privacy Policy.

Why the name Halyzia®?
Legend has it that the mysterious blobs marking the fast-ripples on the normalized scalograms (Figure 1) bore an uncanny resemblance to the delicate colors of a ladybird
Introduction to HFOs
HFOs are brief, high-frequency oscillations observed in EEG recordings. They are typically classified into two main categories: ripples (80–200 Hz) and fast ripples (200–600 Hz). In some cases, high-gamma activity (60–120 Hz) and very fast oscillations (600–2000 Hz or higher) are also included under the broader term HFOs (Figure 1).